The omission of frame pointers complicated stack walking, but .eh_frame data now allows accurate stack unwinding without debug symbols. With Fedora and Ubuntu re-enabling frame pointers, profiling and debugging have become much easier and more efficient.
The Importance of Frame Pointers in Sampling Profilers
A sampling profiler periodically instructs the operating system to collect data about the running processes, typically multiple times per second per CPU core. Each time the profiler gets control, it performs a “stack walk.” This means it analyzes the call stack from the current location where the CPU is executing, tracing back through the function calls to determine the sequence of code that led to that point.
This stack walking helps answer crucial questions: “Where are we currently spending our time?” and “How did we get here?” Historically, performing such stack walks was straightforward, but modern compiler optimizations and architectural complexities have made it much more challenging.
Stack Walking
In the good ol’ days, x86 compilers used a predictable set of assembly instructions (the “standard function prologue”) to manage the stack and frame pointers. This made it a breeze to walk the stack and understand the call sequence. Think of it like having a clear map with marked landmarks.
Here’s an example of that prologue:
push ebp
mov ebp, esp
sub esp, sizeof(local variables)
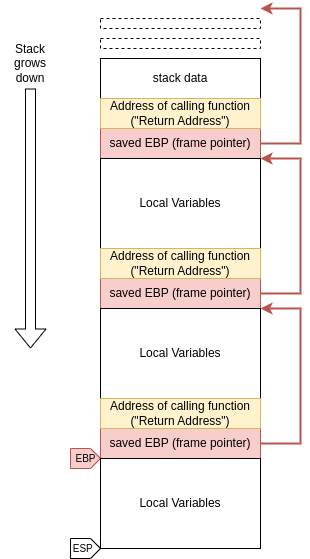
The frame pointer (EBP) used to be a critical register that pointed to the base of the stack frame, allowing easy retrieval of the function call sequence. This method ensured that we could trace the execution path accurately by following these pointers. However, the advent of more advanced compiler optimizations has complicated this process.
The Problem of Omitted Frame Pointers
The x86 architecture had a limited number of general-purpose registers. To improve performance, compiler engineers realized they could free up the frame pointer for general computations by omitting its use and keeping track of the stack pointer (ESP) instead. This optimization, known as frame pointer omission, provided a significant performance boost but at the cost of complicating stack unwinding for profilers.
The rationale behind this trade-off was that developers needing to debug production binaries would use debug symbols, which provide additional data to track the stack pointer’s position. However, this assumption doesn’t hold well for profiling, where simple stack walking without debug symbols is essential.
The Impact on Profiling
The omission of frame pointers breaks the ability of sampling profilers to unwind native stacks through third-party libraries. Even if your code is compiled with frame pointers, any call into a library without them (e.g., libc for memory allocation) disrupts the profiling, rendering the profiler unable to trace the call sequence accurately.
This issue is pervasive as most major Linux distributions ship libraries compiled with frame pointer omission, breaking simple stack walking for profiling. The common workarounds—recompiling libraries without frame pointer omission or deploying debug symbols—are impractical for many organizations due to the complexity and overhead involved.
.eh_frames to the rescue
The challenge lies in finding a way to profile systems effectively without the need for debug symbols or recompilation. Our approach, with Elastic Universal Profiling, leverages C++ exception handling data embedded in executables. This data, present due to the need for stack unwinding during exception handling, is available even in non-C++ projects to ensure interoperability.
By using this data, we can perform full stack unwinding without relying on debug symbols. This involves reading the .eh_frame section of executables, which contains the necessary unwinding information. Our solution uses eBPF (Extended Berkeley Packet Filter) to manage this process efficiently. When our eBPF code encounters an executable compiled without frame pointers, it signals our userspace agent to read the .eh_frame section and convert it into a more manageable data structure. This data is then provided back to the kernel code, enabling rapid stack unwinding.
Framepointers are back
The good news is, framepointer are back again by default.
Following Fedora deciding to enable frame pointers by default for their package builds to help debugging and profiling with the stock packages, Ubuntu Linux is now going to be doing the same.
*source phoronix
Conclusion
The omission of frame pointers, while beneficial for performance, poses significant challenges for profiling. Our innovative use of C++ exception handling data provides a seamless solution for in-production profiling, ensuring accurate stack unwinding without the need for debug symbols or recompilation. This approach simplifies the profiling process, making it more accessible and effective for developers and engineers working to optimize their systems.
The return of framepointers will make life significantly easier for debugging system issues.